Operations control plane2025YankzWorld Admin
Full-stack control plane for a 30-service self-hosted infrastructure
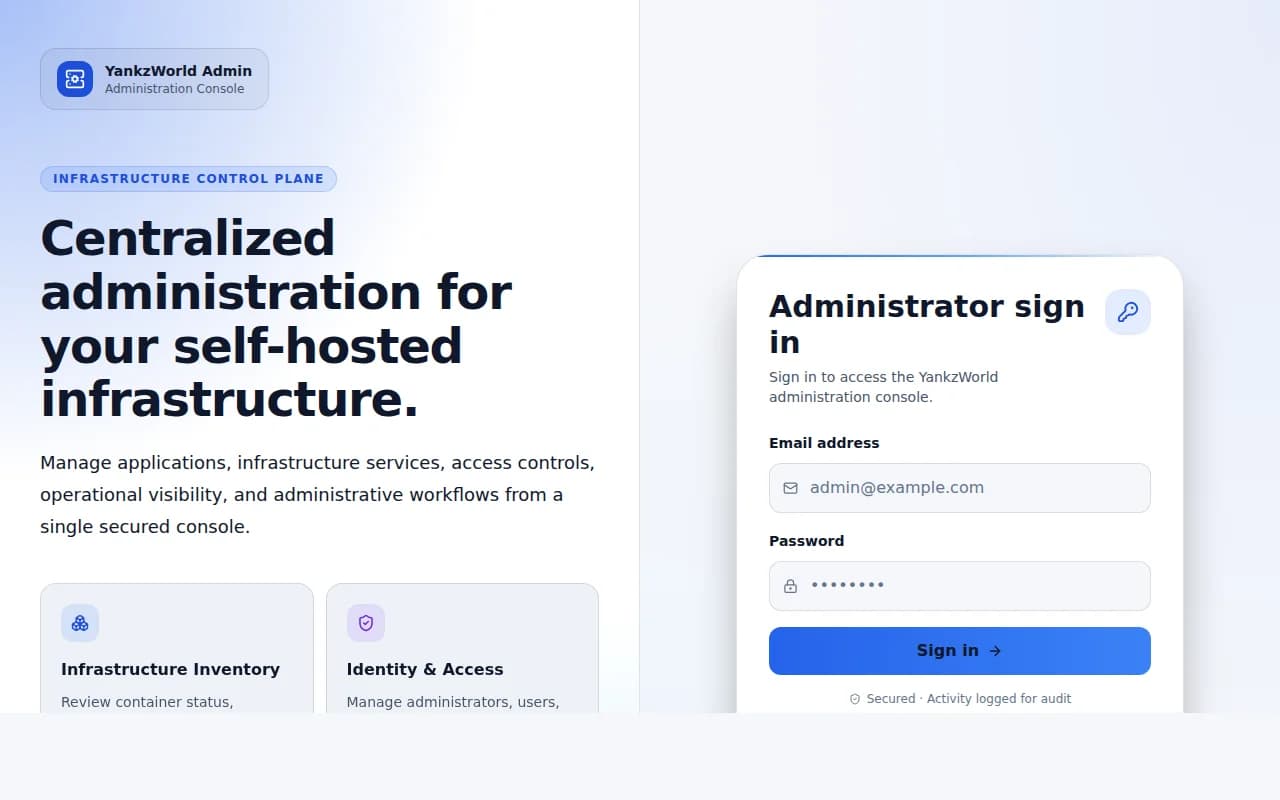
A purpose-built internal platform that consolidates every operational concern into one authenticated interface — container and stack management, domain inventory, HTTP monitoring, analytics, log streaming, scheduled automation, role-based access control, and business modules including a CRM pipeline and Law 25 compliance tracker.
The problem
Managing 30+ self-hosted services across multiple Docker Compose stacks means scattered tooling, no unified access model, and no single place to see what is broken, what needs attention, or who has permission to act on it.
Approach
- React + Vite SPA backed by a FastAPI API; Supabase handles auth, JWT role enforcement, and persistent storage
- Container and stack management — inspect, start, stop, and restart Docker Compose services with per-container live log streaming
- Domain inventory linked to Nginx Proxy Manager — manage proxy hosts, track TLS certificate expiry, and surface domains without a valid certificate
- HTTP uptime monitoring auto-generated for every tracked domain, with check history and configurable alert thresholds
- Umami analytics integration — website traffic, pageviews, top pages, referrers, and device breakdowns proxied securely through the API
- Granular role-based access control — global roles plus per-module permissions, with automatic profile sync when a user is assigned to or removed from an application
- Dynamic app registry that discovers Docker Compose projects, maps running containers to their registry entries, and links domains to their owning app automatically
- Automation hooks, scheduled worker jobs with cron configuration, notification routing, and a maintenance mode toggle for each service
- Business modules colocated in the same control plane: Leads / CRM pipeline, Law 25 compliance tracker, and StreamCore live-streaming management
Outcome
- Every operational task — containers, domains, backups, monitoring, users, and automation — accessible from a single login without switching tools
- Access enforced at the module level: operators see and act only on what their role explicitly permits
- Scheduled automation keeps the app registry, domain links, and monitoring checks continuously in sync without manual intervention
Got a project that's been waiting too long?
We respond to every inquiry within one business day. No funnels — just a real conversation about whether we're a fit.